Importance of Gate Location in Plastic Injection Molding
In the plastic industry, the material injection point often referred to as gate location is crucial in the determination of the part performance. Functional characteristics like flatness, roundness, dimensional stability, in-mold stress and others could be improved or reduced just by changing the gate location. The part processing conditions could also be severely impacted by the injection point allowing to balance the fill path or to extend the packing time, for example. Lastly, the gate location also influences a myriad of additional part quality attributes like fiber orientation, weld-lines, air traps, jetting, sharp vestiges and others. In conclusion, the polymer entry spot is as important as the part design itself.
General Considerations for Gate Location
Over time, general guidelines for gate location have been developed, studies and floor experiences helped shape this “rule of thumb” approach to gate placement. One of the most important ones is the “Thick to thin” rule. It establishes that to be able to fill the part with the least amount of pressure the gate must be placed in the thickest area of the part geometry. Doing this will also help to avoid early solidification of the material and additional time before the gate freezes during the packing phase. There are many other generic rules, but even after carefully considering all of them many parts come out of the mold with unexpected defects related to the gate location. Why?
Case Study: Automotive Cam Cover
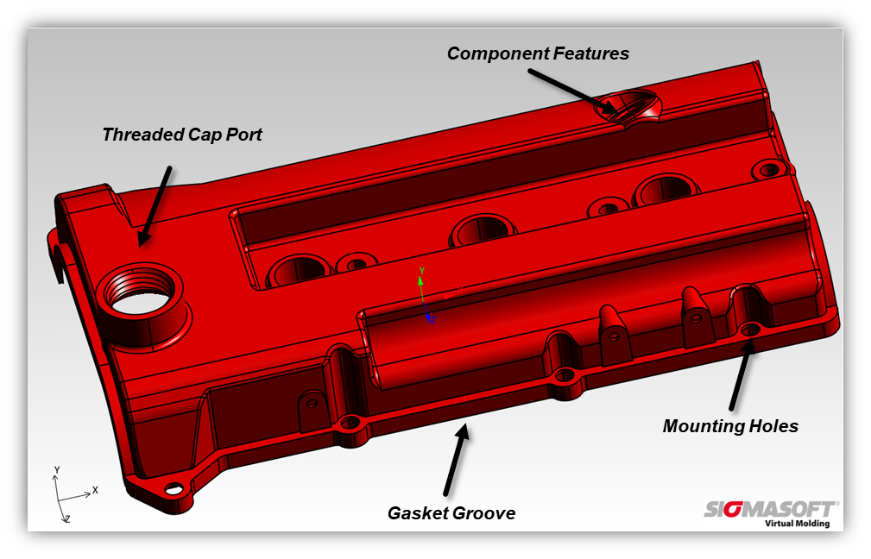
Let’s take a look at the Cam Cover on picture 1. This is an automotive part with strict dimensional constraints. There are crucial quality requirements for flatness along the mounting flange, this is because the part requires a tight seal in the assembly interface. Also, close to perfect concentricity in the oil cap port is needed. The part is not symmetrical, any gate vestige needs to be minimized and is meant to be manufactured from PPS 35% glass filled. So, where would you place the gate? Would you use multiple gates? What type of gate would you use? These are questions that typical “rule of thumb” considerations won’t help you answer.
Thickness and Solidification Analysis
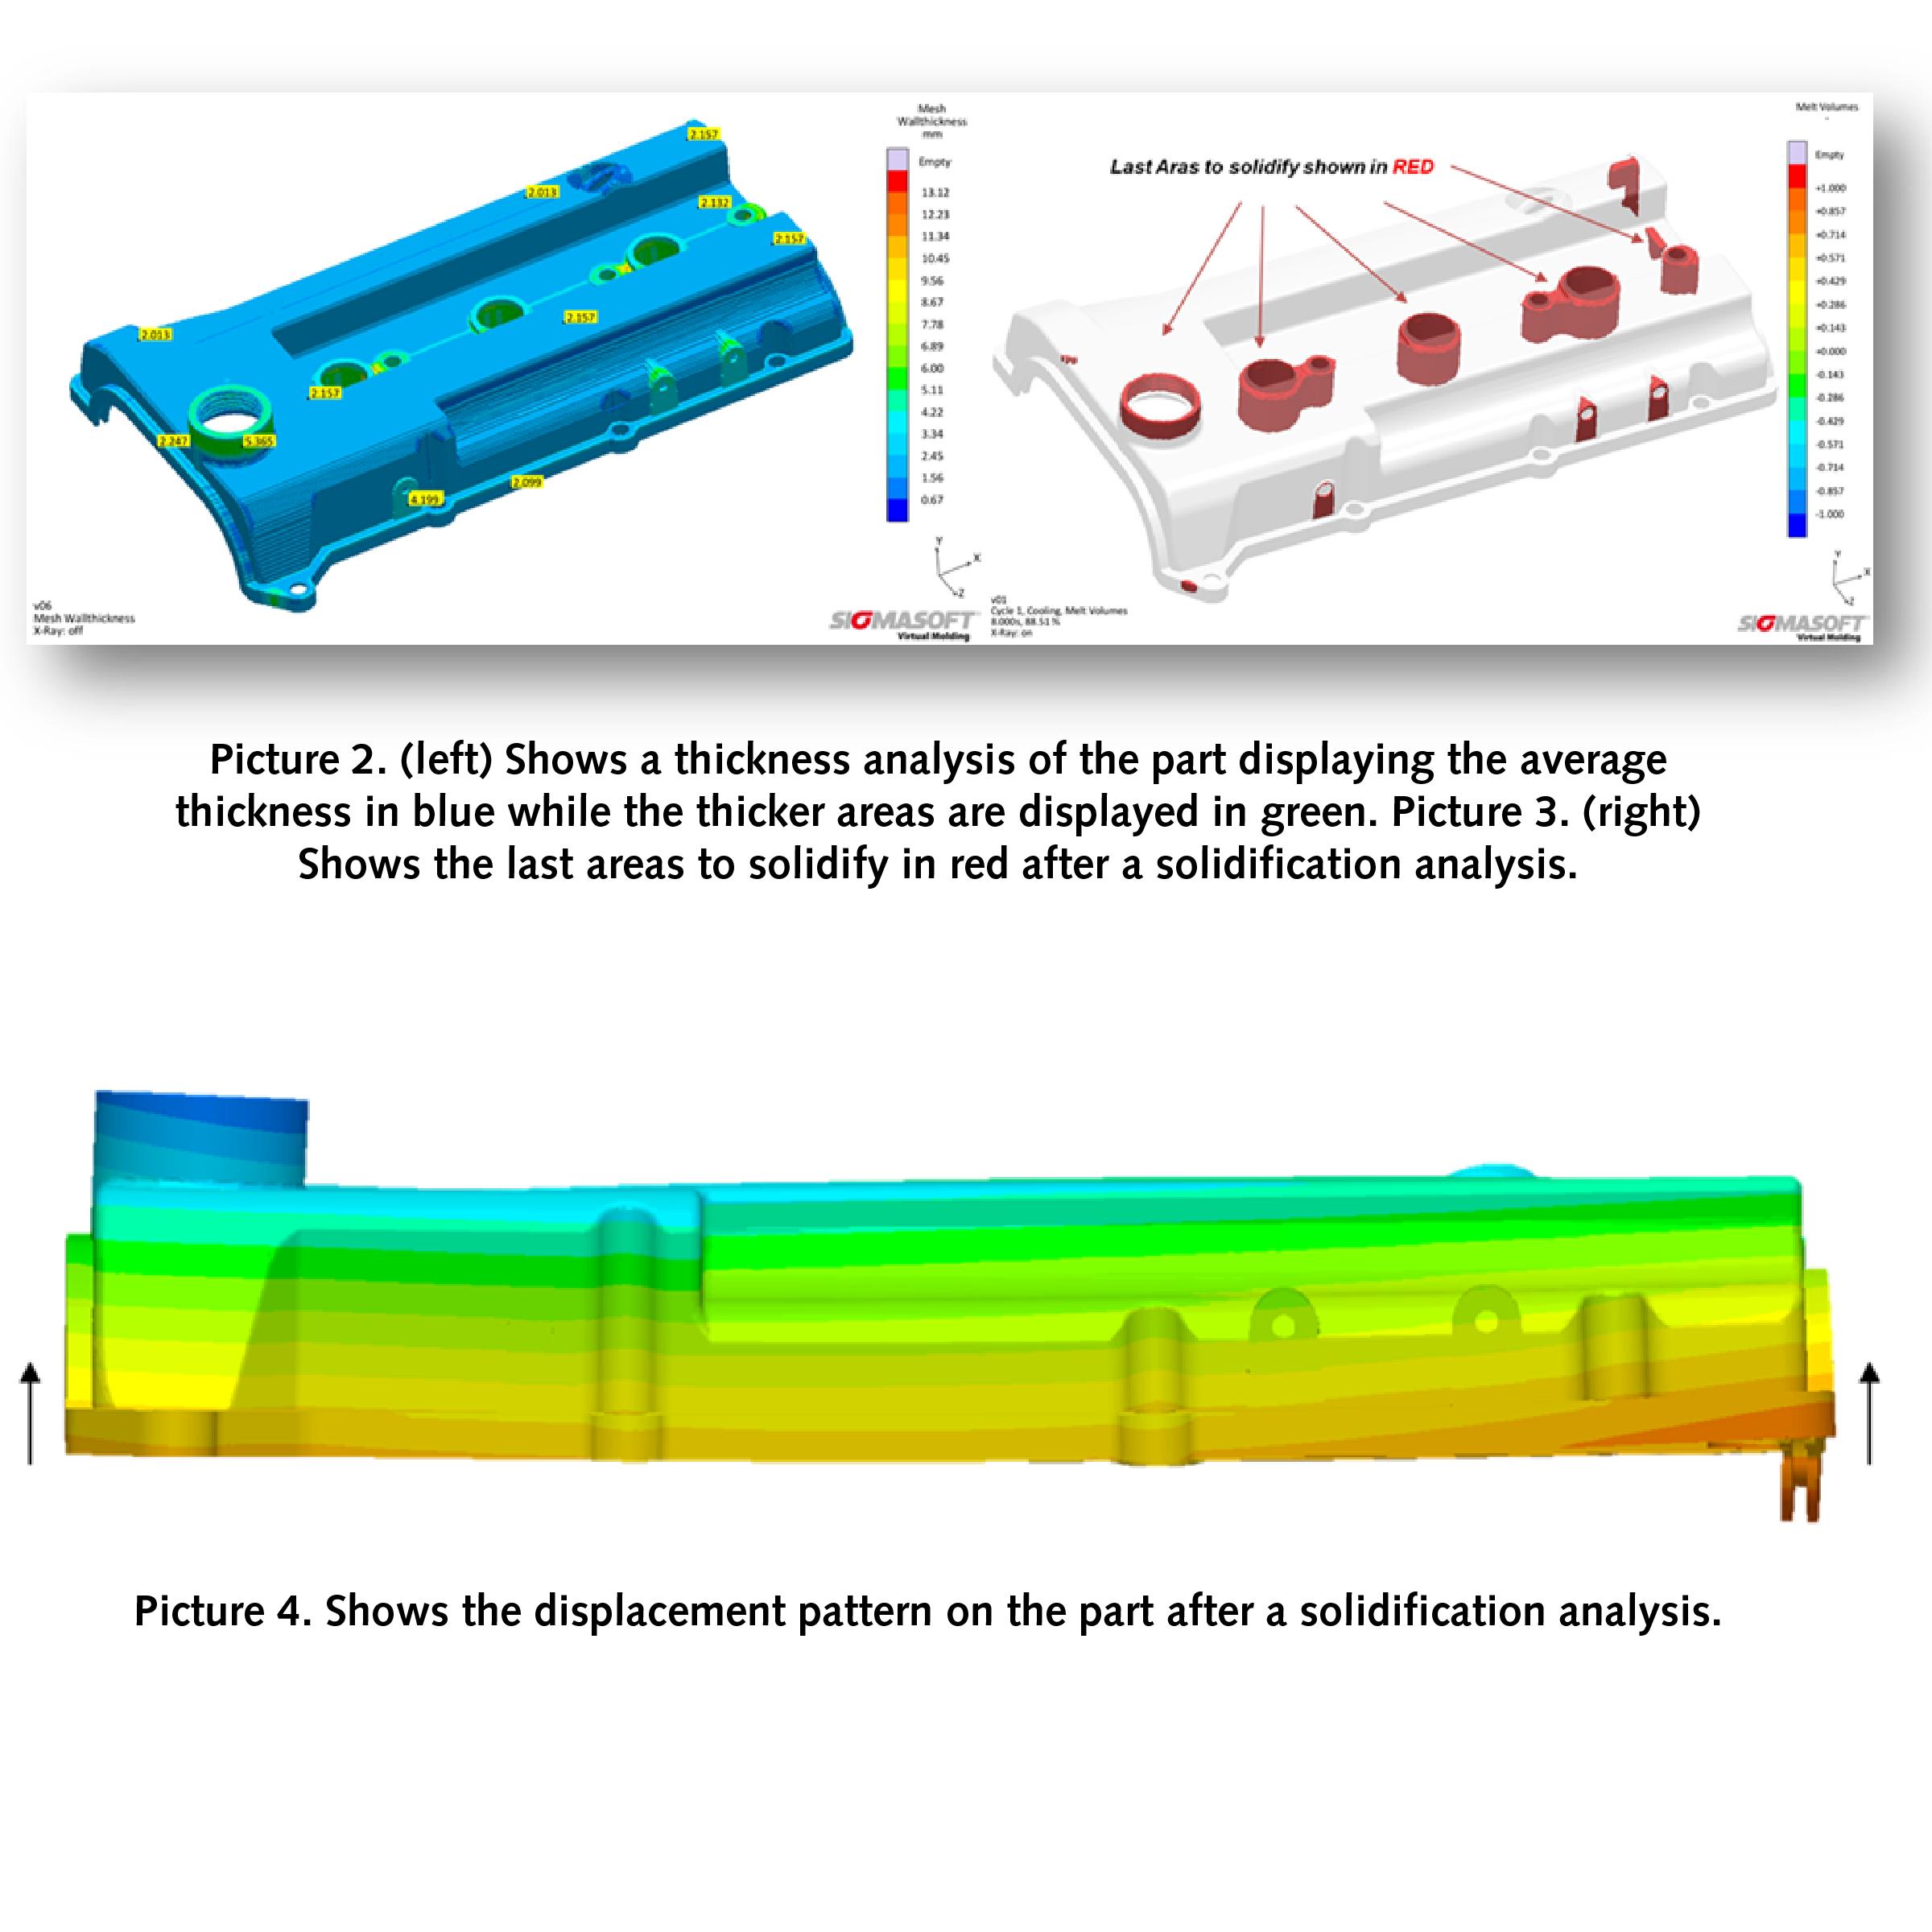
The first action before defining the possible gate’s location should be to perform a thickness analysis. Through this evaluation the thick and thin regions of the part walls could be easily identified. Picture 2 shows an average thickness of 2 mm while the thickest region of 5.4 mm is located at the threaded port for the oil cap. There are also other thick sections in the center of the part. Following this evaluation a simple solidification analysis shown on Picture 3 may be completed to visualize the last areas to cool down. These areas will drive the cycle time and have great influence in the part final shape, as different cooling rates between regions introduce shrinkage differential. This means that while thin wall sections have solidified and have finished shrinking, thick sections are still cooling down and continue to shrink until they reach a solid state. It is worth mentioning that in this case the part material also plays a crucial role since crystallization which is natural to semi-crystalline polymers provides further opportunities for the material to keep shrinking even after ejection.
A solidification analysis is where the part is placed inside a cube of steel on perfect and uniform starting conditions on both elements are left to thermally interact until the part reaches the recommended ejection temperature. There is no influence of filling, switch over, packing or any other process parameter. The part displacement resultant from these ideal conditions may serve as a benchmark for any other analysis that follows. In this case the polymer material starting temperature was 650F while the mold set temperature was 284F. Picture 4 shows the displacement pattern of the part, notice how the color bands are not parallel to the bottom surface of the part but instead the are bowed across the length suggesting that the corners will displace upwards while the center may move down. The effect of fiber orientation has not been considered, which the main factor of influence for parts molded with kind of resins.
Gate Placement Evaluation
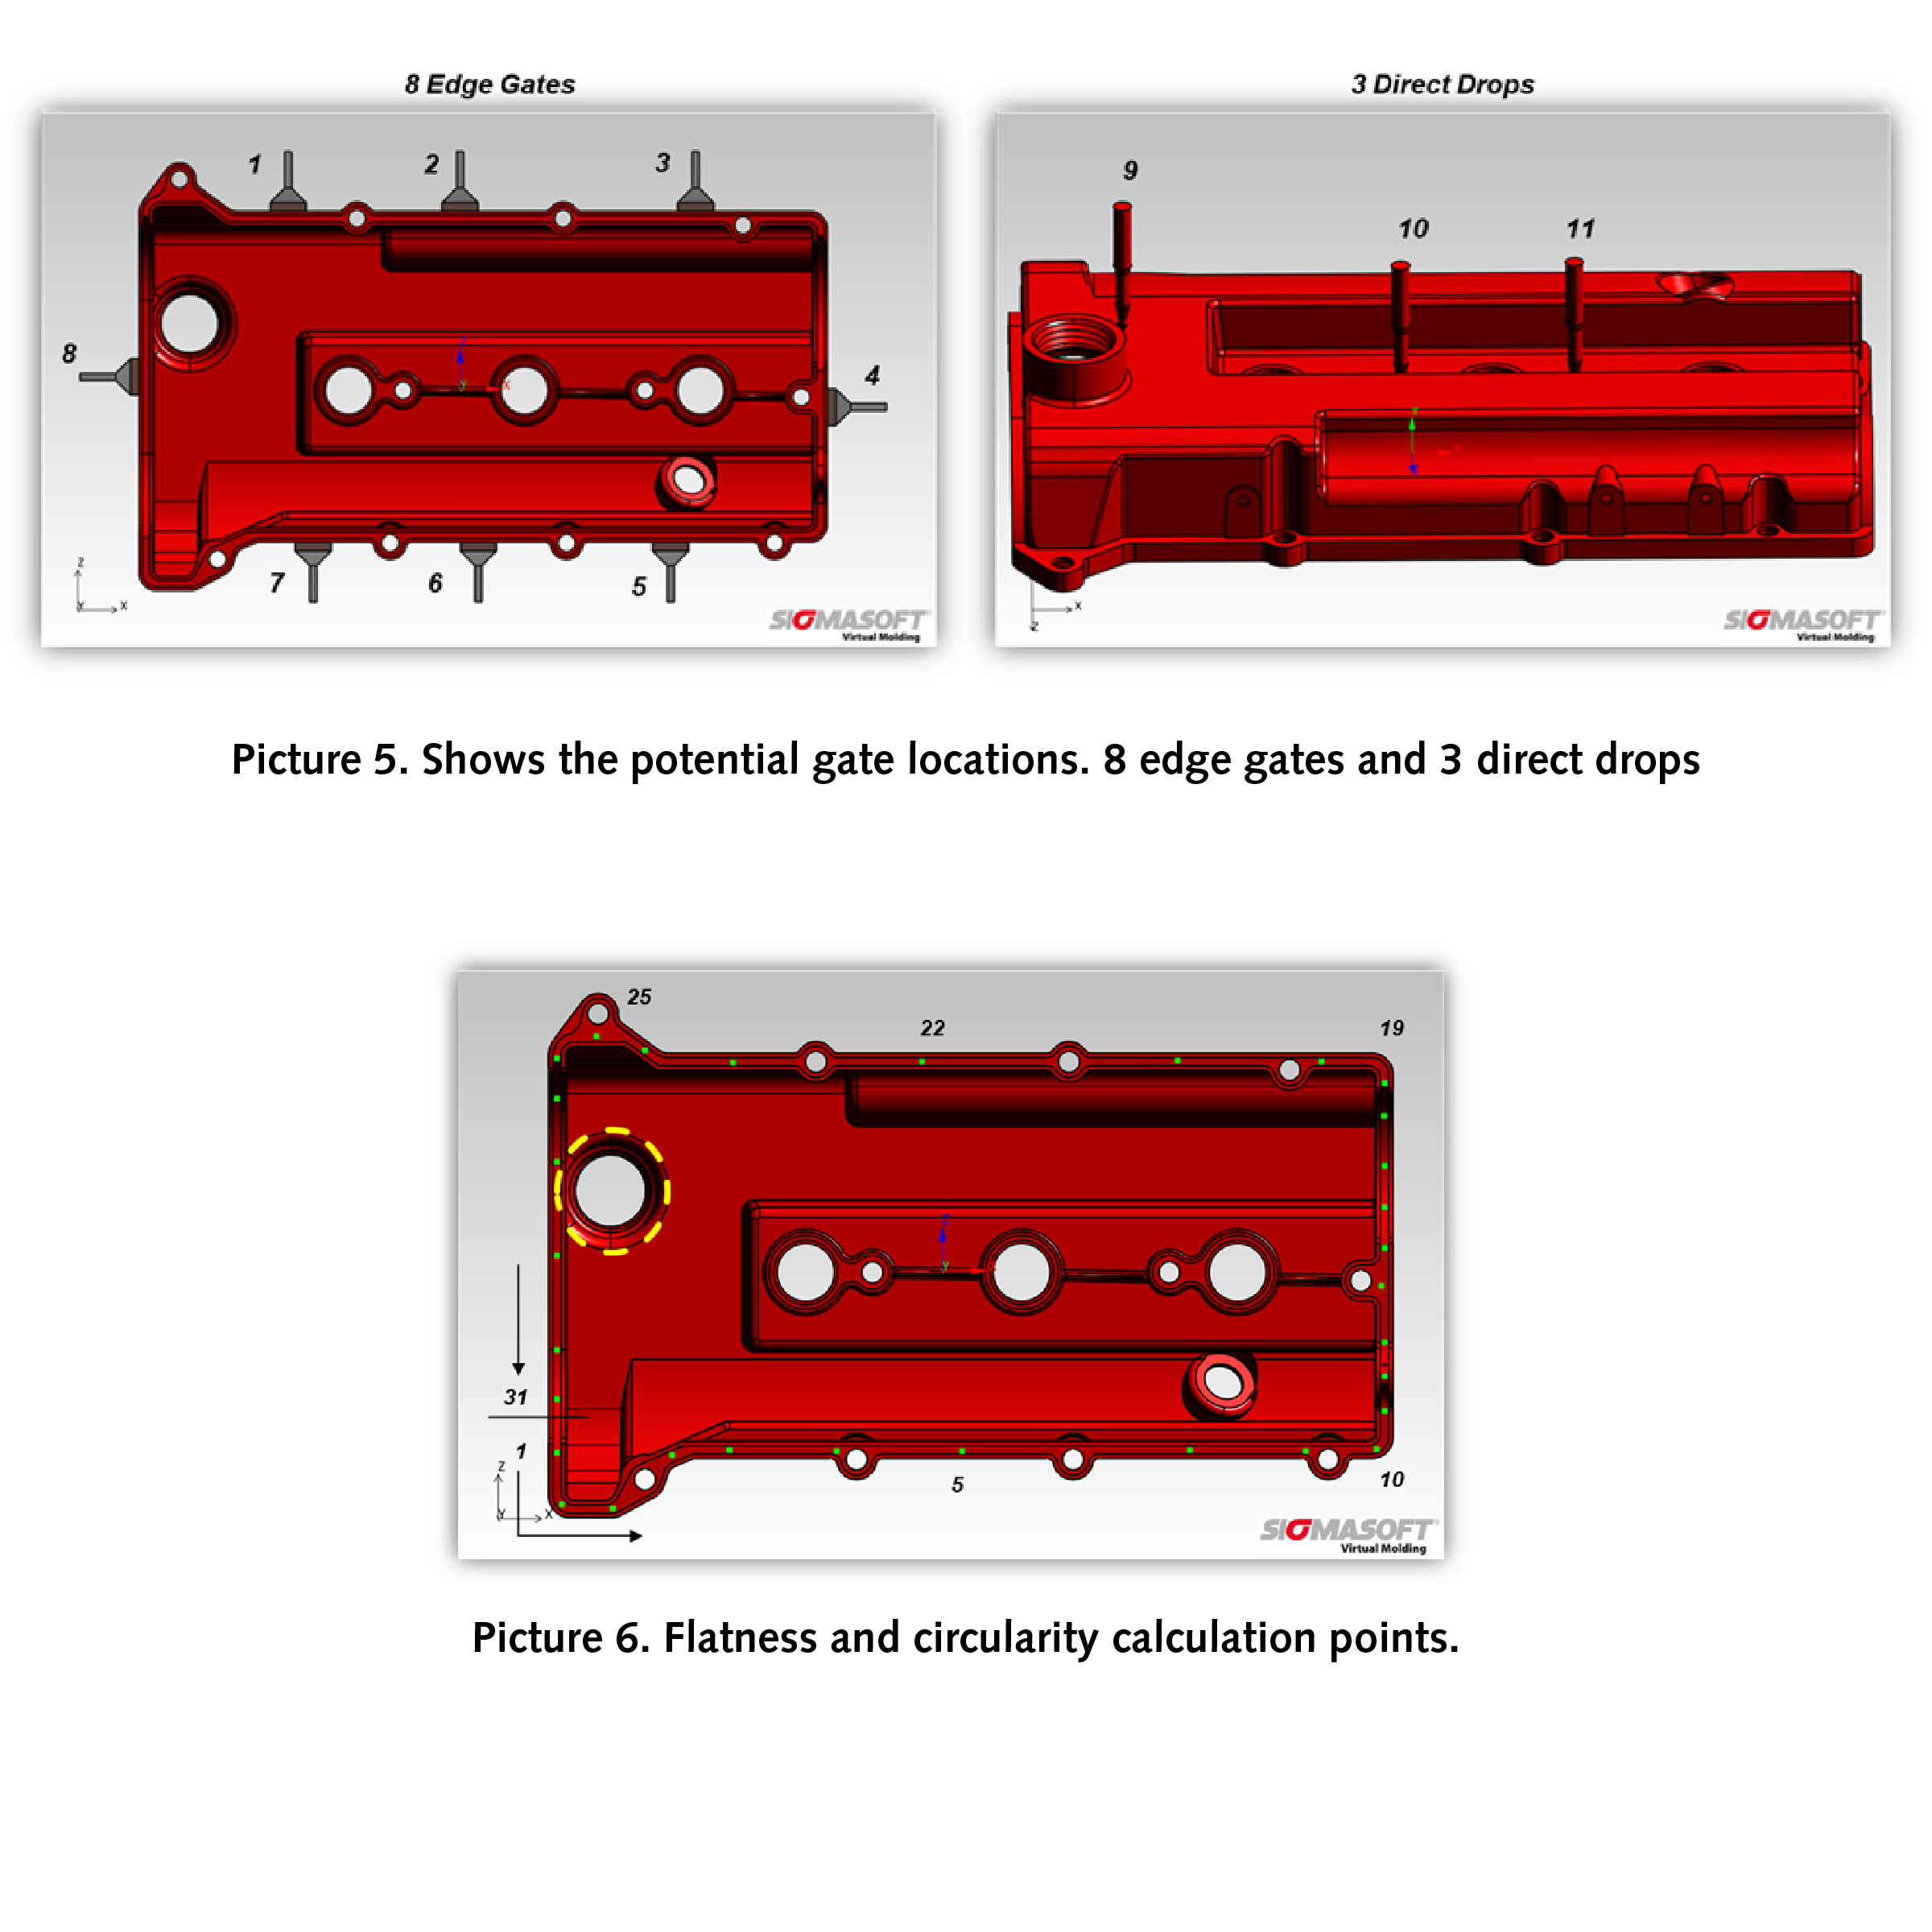
Now that we know the displacement of the part under perfect conditions, the next step is to consider polymer flow and select the gate locations that get us closer to the desired quality. To start we have to define where gates could be placed, then what will be evaluation objectives. Even though the threaded cap port is the thickest wall it is not possible to gate in that area, it is not permitted by the OEM for a gate vestige to exist closer a region that will be in contact with the operator or any other assembly component. Picture 5 shows the areas where gating is permitted, 8 edge gates and 3 direct drops in the center of the part. There are 11 single gate configurations that will be evaluated and 55 combinations of 2 gates possibilities. In total 66 potential gate location combinations will be analyzed.
To define the analysis objectives, a series of calculation points were placed around the gasket groove and the threaded cap port. They were used to calculate flatness in the groove and circularity in the port. Additionally, an objective to reduce air entrapment was defined so all 3 objectives were utilized at the same time to determine the best gate location. Picture 6 shows the calculation points location, a total of 31 for the groove and 12 for the port.
Flatness and Circularity Analysis
Using the assessment perspective in SIGMASOFT allows the user to take a quick decision over which gate produces the best compromise given all 3 objectives. Regardless, the following paragraphs and images deconstruct the gate selection process with visual aids considering each objective separately.
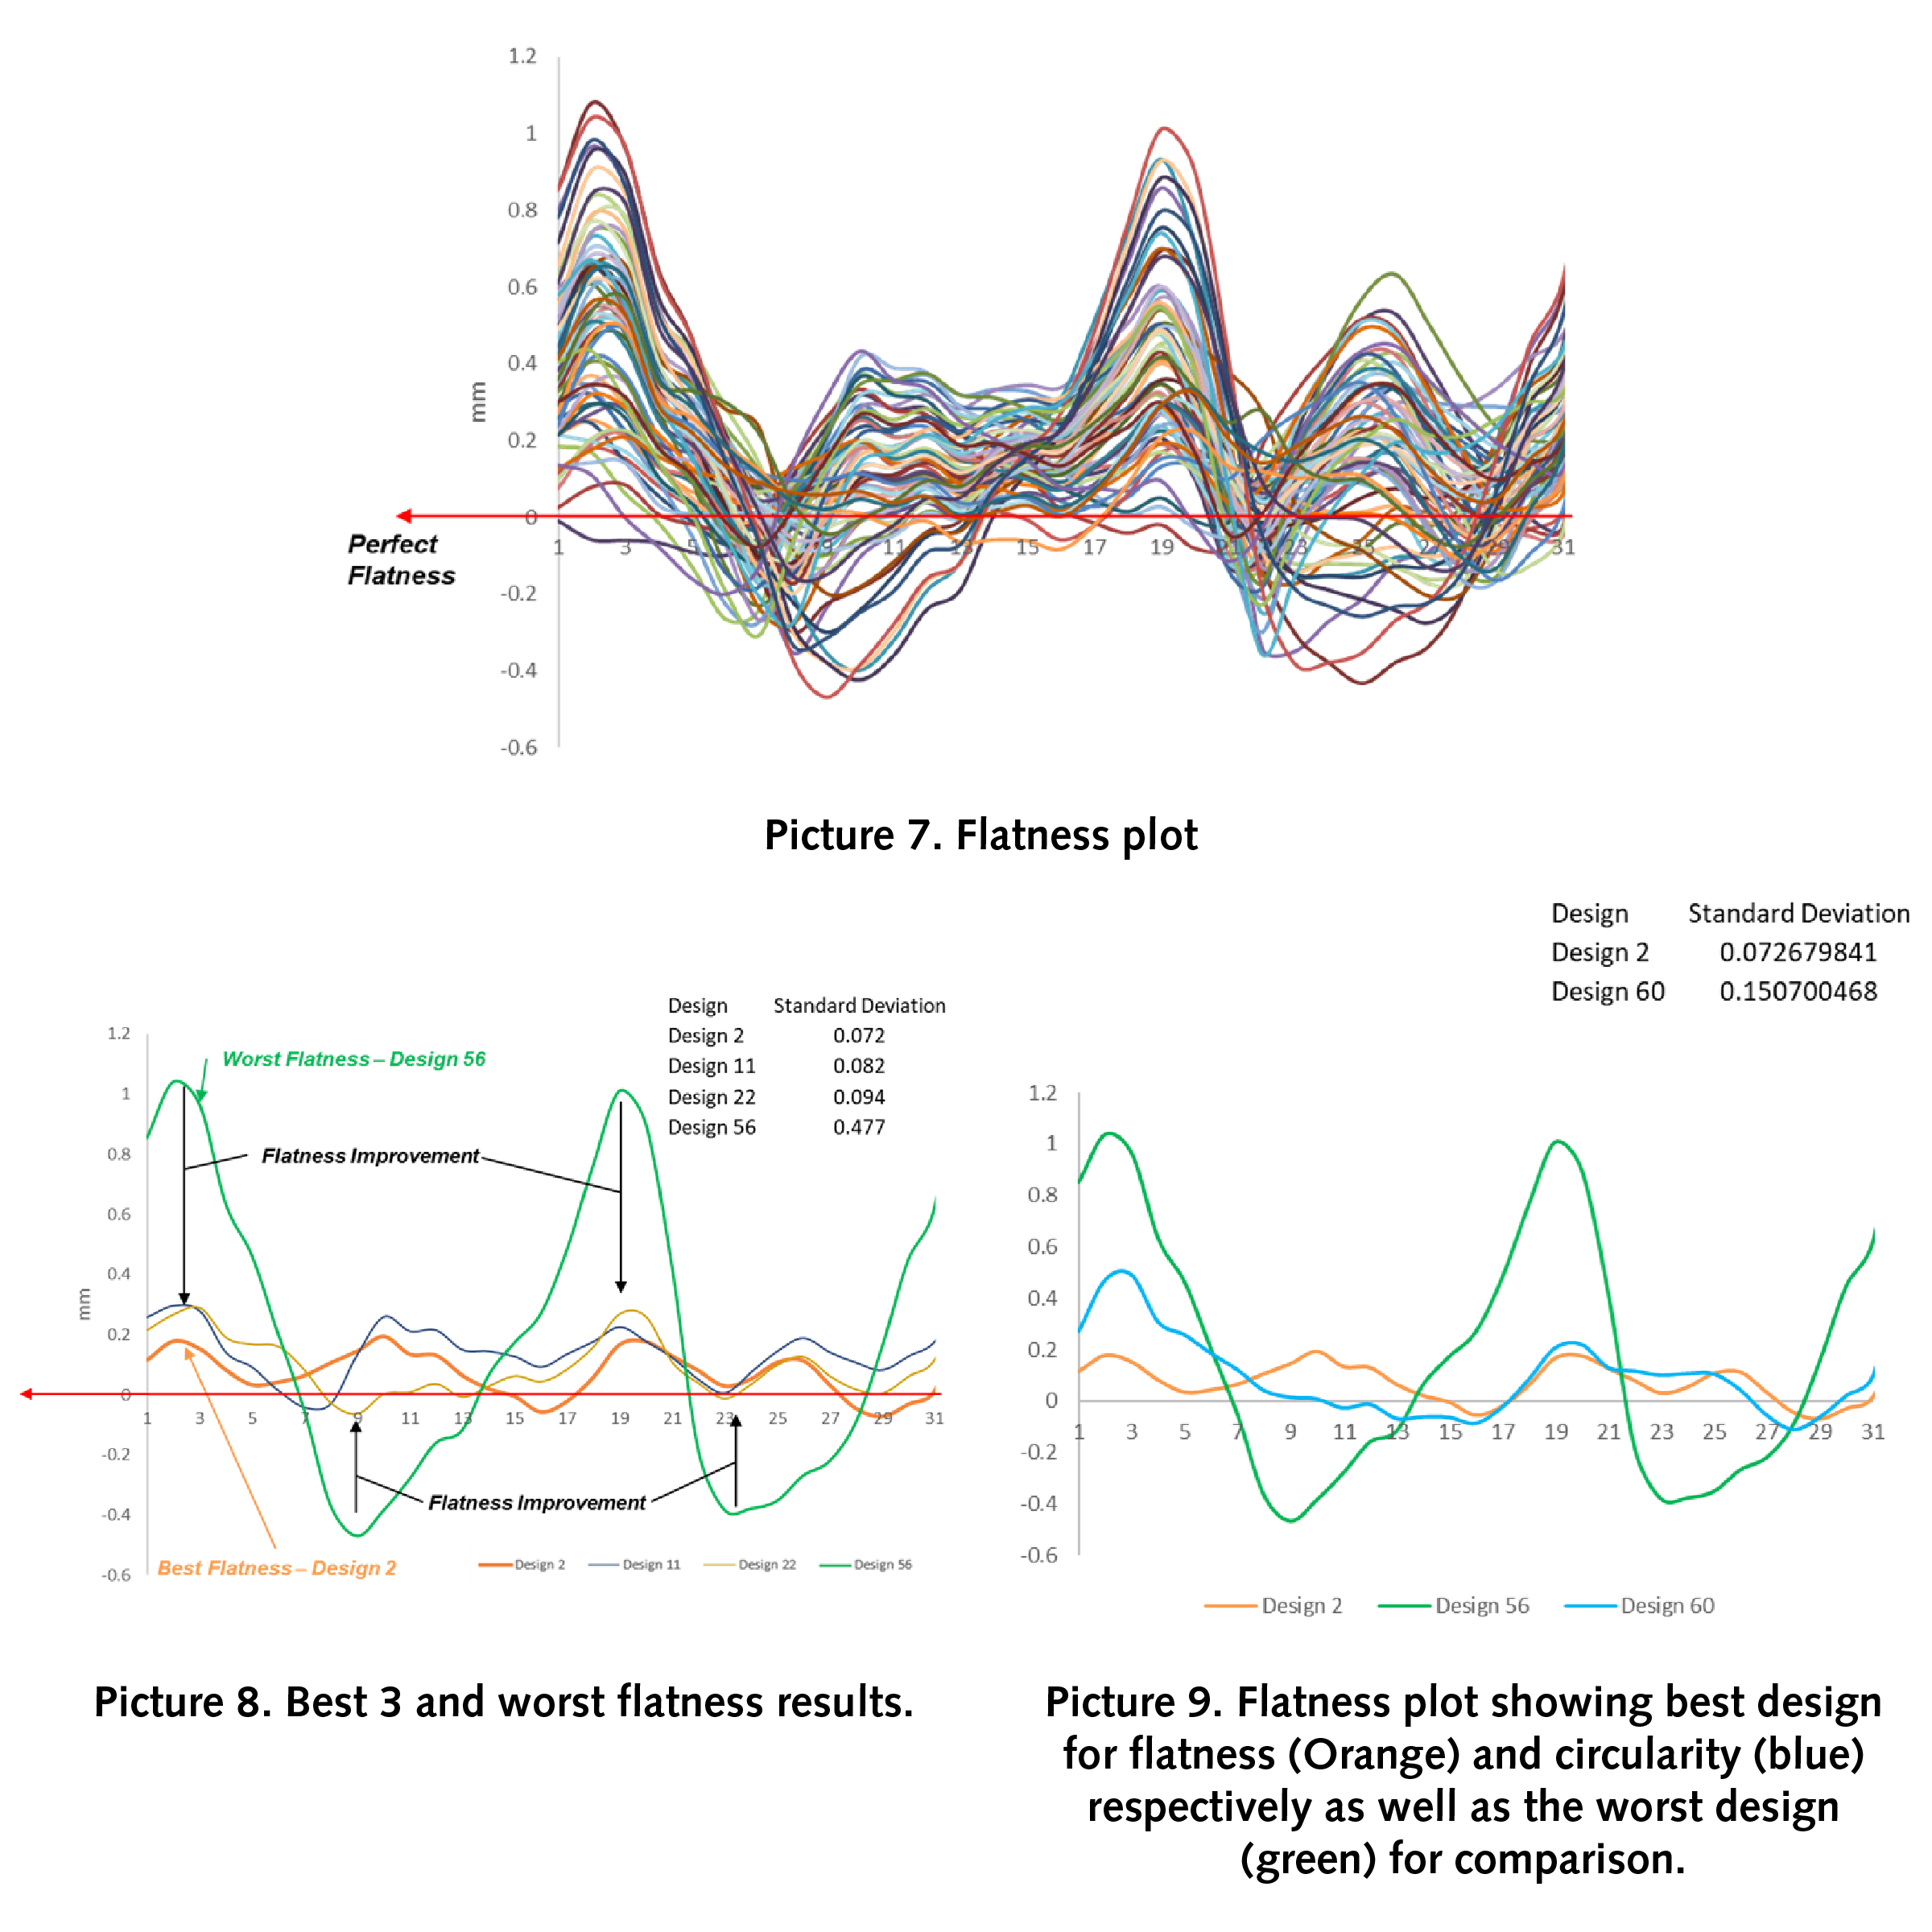
Picture number 7 shows a chart with the displacement per point of calculation of each gate combination for the flatness objective. The Y axis shows displacement in mm while the X axis each point location. Each colored line represents a gate combination or design. There is also a perfect flatness red line placed across the “0”. Notice how the displacement magnitude ranges from 1.2 mm to -0.4 mm.
After decluttering the plot and leaving only the best 3 design for flatness and the worst one for comparison purposes shown in picture 8. It is possible to observe that there is an improvement of more than 1 mm from the worst to the best 3 designs. Design #2 results in the best flatness with the lowest standard deviation across the evaluation points.
Next, we introduced to the flatness plot the best result for circularity at the threaded port, see picture 9. The standard deviation for the displacement at the evaluation points doubles for Design #60 which is the best for circularity. From section 15 to 31 of the evaluation area the displacement behaves similar between both designs, but there is a slight difference in the first half of the evaluation area.
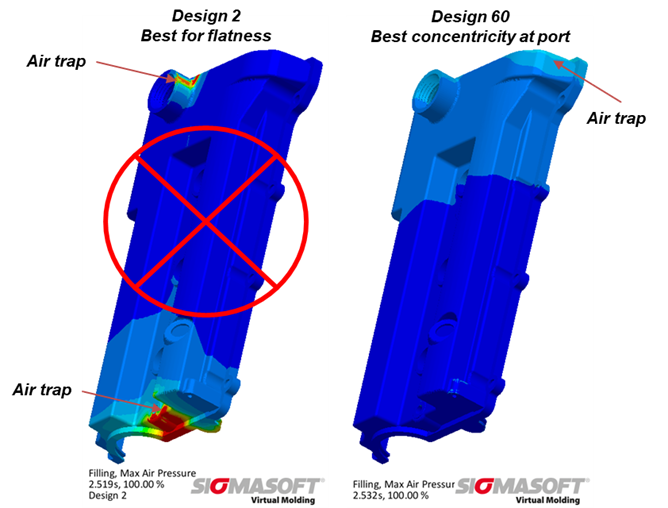
Lastly, the air entrapment was checked to confirm that design 2 was the best option before moving forward with the mold design phase of the project. To our surprise, as seen in picture 10 the best flatness design shows a major air trap in the threaded port area while design #60 shows all the air being displaced to the parting line with low air entrapment possibilities.
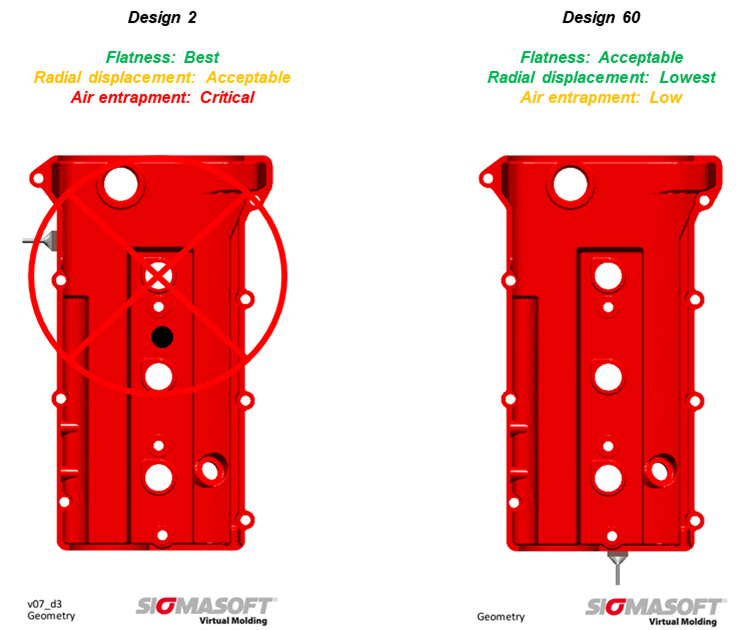
The final gate selection is shown in picture 11. Design #60 displayed acceptable flatness while having the lowest radial displacement at the cap port and no air entrapment in critical areas. Notice how the best gate for the objectives analyzed was not possible to be chosen by using the common “rule of thumb” approach. This case study highlights the importance of proper evaluation of all the options considering the critical quality factors before taking a decision on crucial aspects like gate location.
